COP
 "
"
Cost of Production Planning
Echelon™ COP Planner is a custom web application developed for Crop Production Services (Canada) Inc. that assists in development of financially evaluated Crop Plans. It allows Users to compare the cost of production and potential bottom line revenues for alternative crop plans and to evaluate their operational costs and production results against system-wide aggregated data.
Its intuitive interface is designed to work seamlessly on both desktops and tablets including both Android and iOS devices. The custom workflow requires that CPS representatives do the initial setup to add a Grower to the cloud database. Once the account is configured, both the CPS representative and the Grower have shared access to collaborate on crop planning.
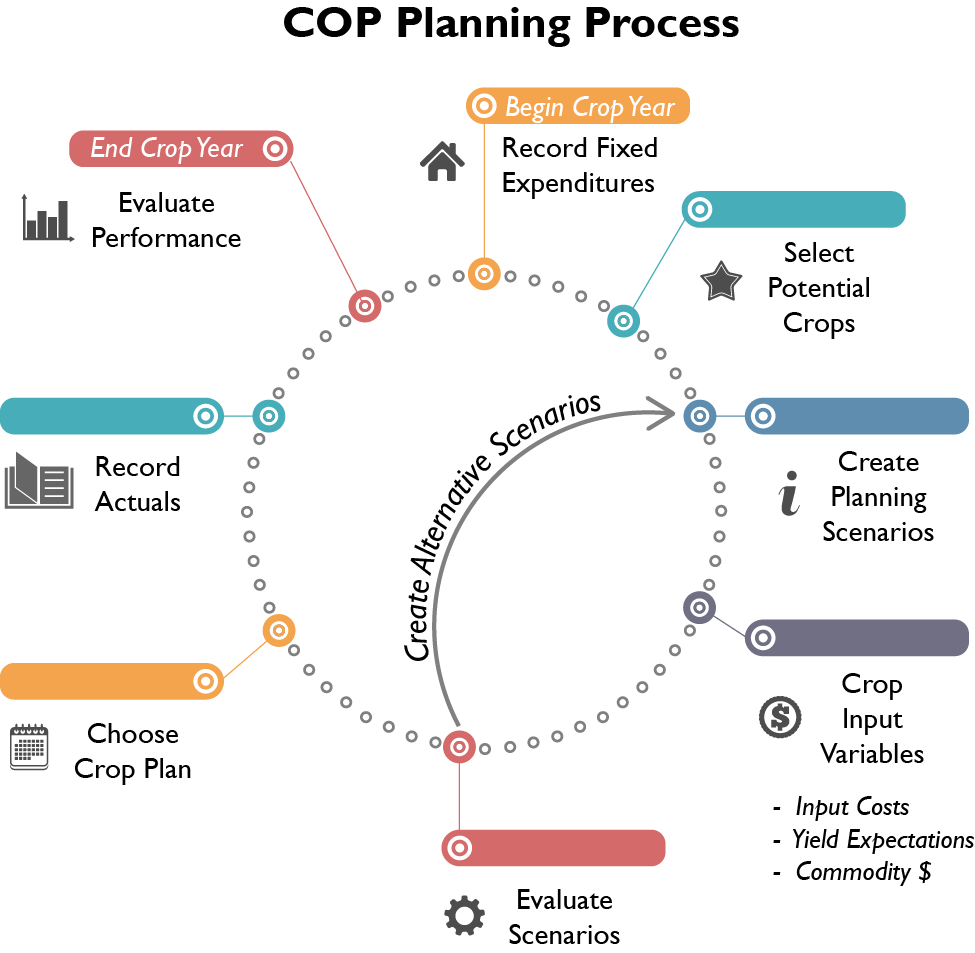
Scenarios may differ by any number of variables. These include adjusting the acres allocated to different crops, the type of crops grown, or any number of cost inputs or performance estimates. Deciding which Scenario to adopt as the “Crop Plan” requires comparing the net revenue and risks associated with each scenario. To help with the comparisons, COP Planner offers comparison graphs that summarize each Scenario, the calculated Profit per Acre and a calculated ‘Risk’ index.
Web App Features
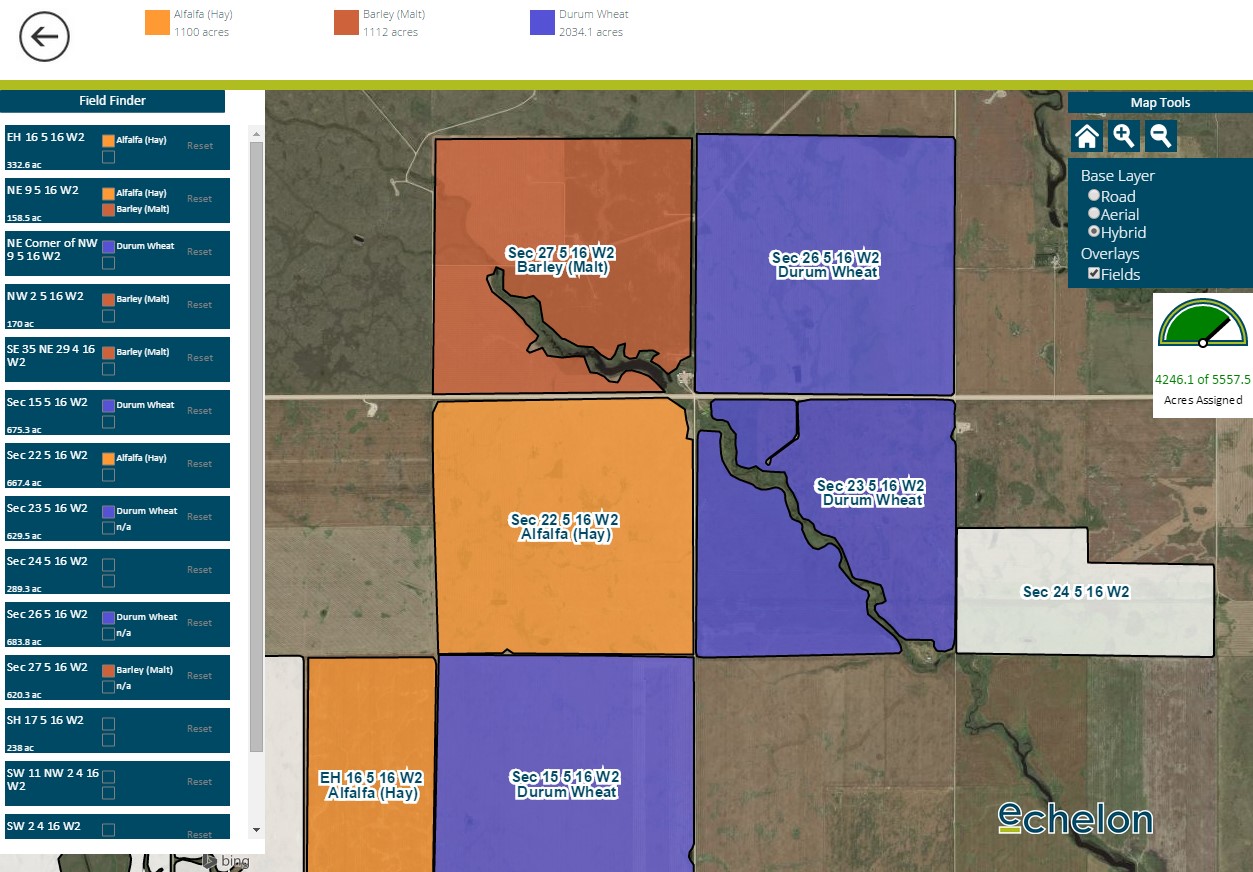
Map Crop Plans
- Fields Maps
- Import GIS Shapefiles.
- Field History
- Production results are entered and orgnaized by Crop Year making it easy to view past history.
- Drag'n Drop
Planning- Assign crops to fields by drag and dropping the desired crop onto the field.
- Progress Tracking
- Monitor the total acres planted by crop type and amount of total acres planned.
- Map Layers
- Use satellite and road map layers to easily navigate the map display.
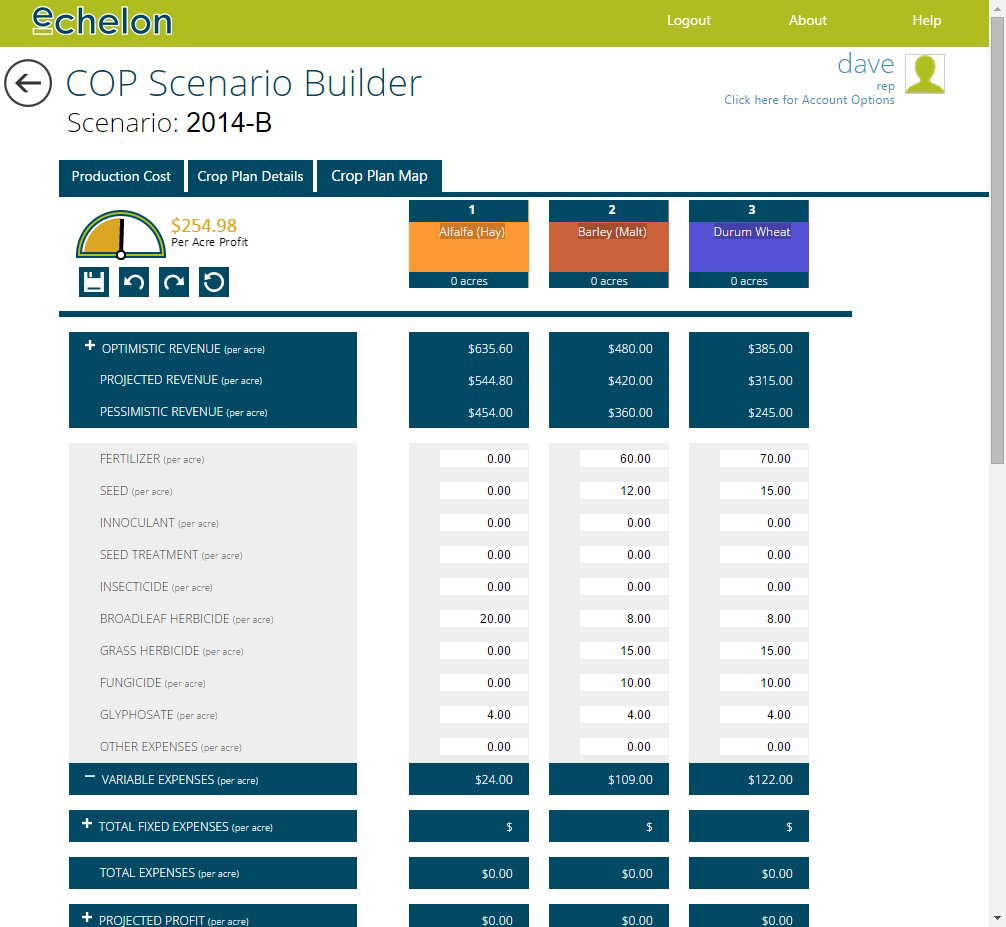
Create Crop Plan Scenarios
- Fixed Expenditures
- Record and categorize annual Administration, Operation and Labour expenditures.
- Crop Selections
- Select possible crops types to include in planning scenarios.
- Build Scenarios
- Create alternate crop plan scenarios that may consist of different crop mixes, acreage allocations, variable input costs and projected market prices and yields.
- Assign Crops
to Fields- Acreage by crop type is calculated as crops are assigned to fields using either the map view or table list of fields.
- Crop Input Costs
- Each crops type has default input costs for items such as Fertilizer, Seed, Inoculants, Herbicides & Fungicides, among others.
- Commodity Yield &
Price Expectations- Projected yields and market prices ranges may be adjusted for each scenario. These are later evaluated against the actual results.
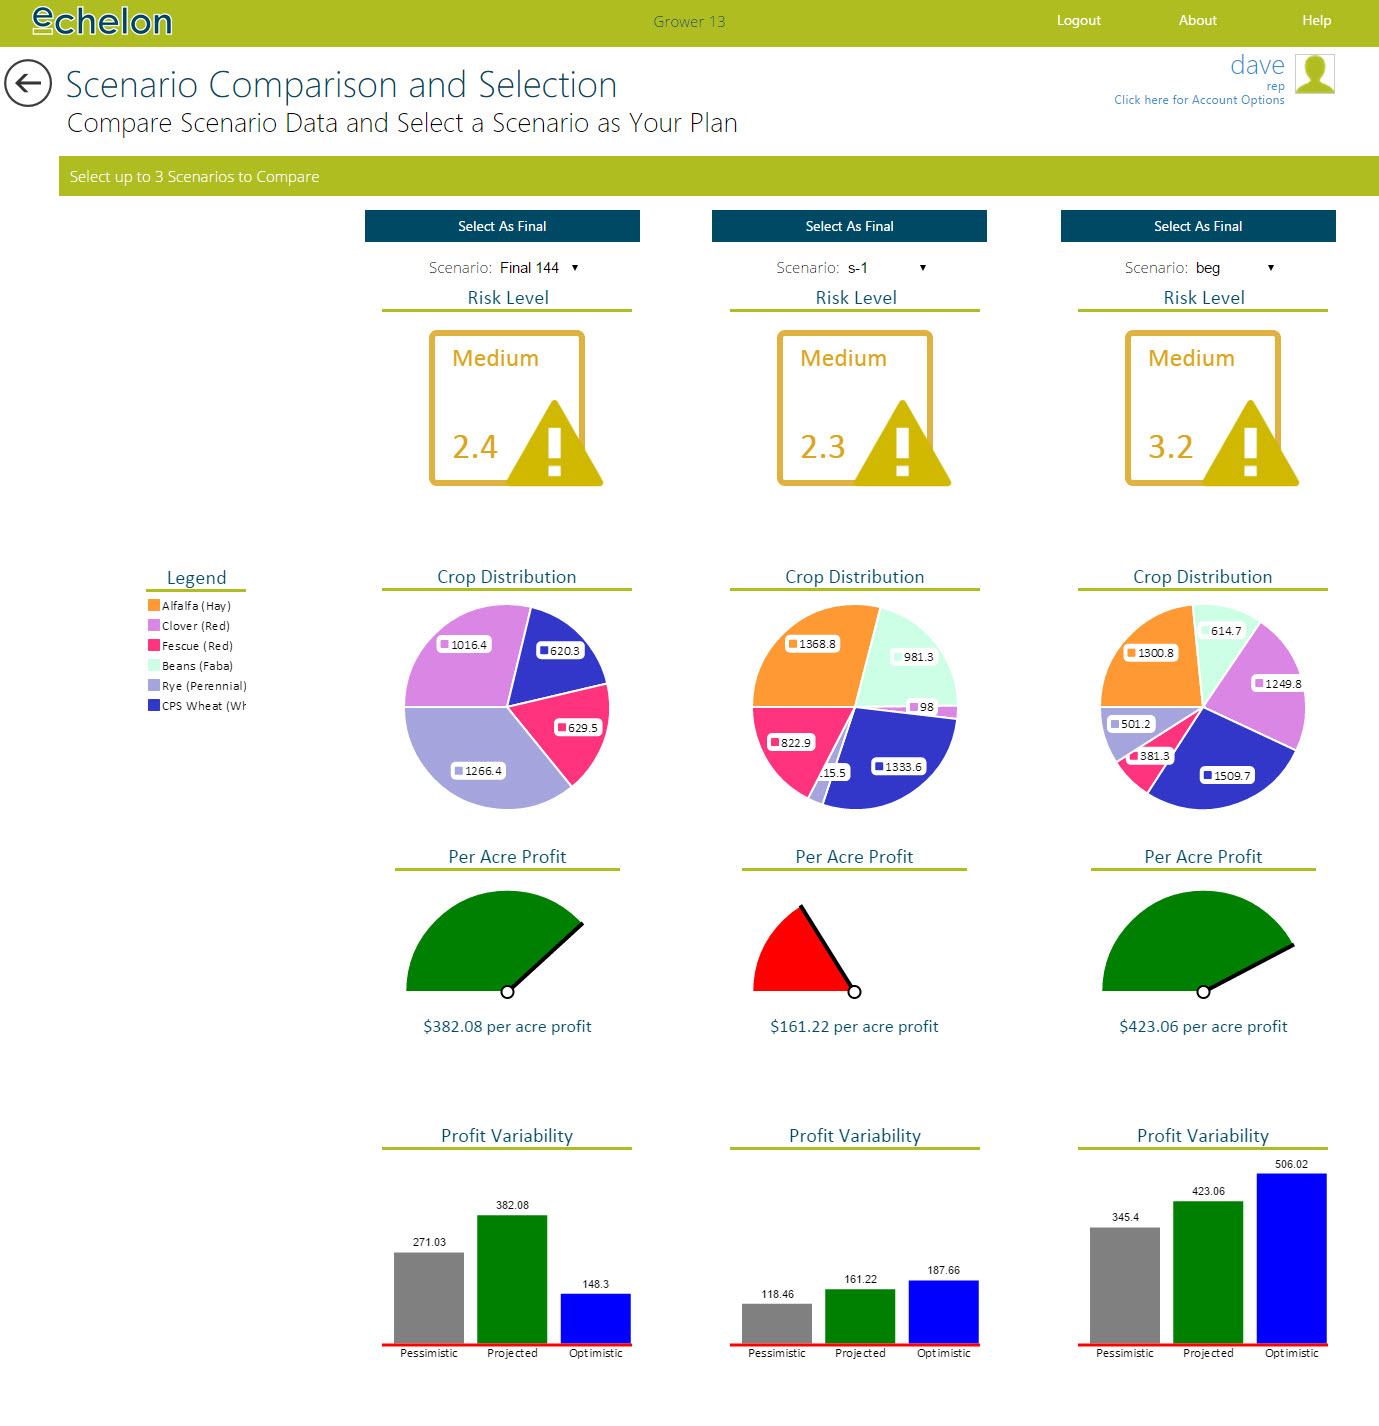
Evaluate Scenarios and Create a Crop Plan
- Scenario
Comparisons- Compare alternate scenarios using graphical summaries of projected revenue, crop distributions and risk potential.
- Select a Plan
- Select a preferred plan and later enter the actual end-of-season results to evaluate the plan performance.
- Results
- Production yield is recorded either by field or as aggregated value along with current and project market prices.
- Production
Reports- Production results are graphical presented to summarize production & input costs by crop type.
- Benchmark
Reports- Compare actual performance to system-wide benchmark data on production, input costs and operating expenses.
COP Planner Login
© FieldTRAKS Solutions 2016.